```{r, include = FALSE}
source("../setup.R")
```
## Overview
We will cover:
* Common re-sampling methods: **bootstrap**, **cross-validation**, **permutation**, **simulation**.
* **Cross-validation** for checking generalisability of model fit, parameter tuning, variable selection.
* **Bootstrapping** for understanding variance of parameter estimates.
* **Permutation** to understand significance of associations between variables, and variable importance.
* **Simulation** can be used to assess what might happen with samples from known distributions.
* What can go wrong in high-d, and how to adjust using **regularisation** methods.
## Model development and choice
 ## How do you get new data? {.transition-slide .center}
## Common re-sampling methods
:::: {.columns}
::: {.column}
::: {.info}
- [**Cross-validation**]{.monash-blue2}: Splitting the data into multiple samples.
- [**Bootstrap**]{.monash-blue2}: Sampling with replacement
- [**Permutation**]{.monash-blue2}: Re-order the values of one or more variables
:::
::: {.incremental}
- [Cross-validation]{.monash-orange2}: This is used to gain some understanding of the [variance]{.monash-orange2} (as in *bias-variance trade-off* ) of models, and how parameter or algorithm choices affect the performance of the model on future samples.
:::
:::
::: {.column}
::: {.incremental}
- [Bootstrap]{.monash-pink2}: Compute [confidence intervals]{.monash-pink2} for model parameters, or the model fit statistics. can be used similarly to cross-validation samples but avoids the complication of smaller sample size that may affect interpretation of cross-validation samples.
- [Permutation]{.monash-green2}: Used to assess [significance of relationships]{.monash-green2}, especially to assess the importance of individual variables or combinations of variables for a fitted model.
:::
:::
::::
## Cross-validation
- [Training/test split]{.monash-blue2}: make one split of your data, keeping one purely for assessing future performance.
After making that split, we would use [these methods on the training sample]{.monash-orange2}:
- [Leave-one-out]{.monash-orange2}: make $n$ splits, fitting multiple models and using left-out observation for assessing variability.
- [$k$-fold]{.monash-orange2}: break data into $k$ subsets, fitting multiple models with one group left out each time.
## Training/test split [(1/3)]{.smaller}
## How do you get new data? {.transition-slide .center}
## Common re-sampling methods
:::: {.columns}
::: {.column}
::: {.info}
- [**Cross-validation**]{.monash-blue2}: Splitting the data into multiple samples.
- [**Bootstrap**]{.monash-blue2}: Sampling with replacement
- [**Permutation**]{.monash-blue2}: Re-order the values of one or more variables
:::
::: {.incremental}
- [Cross-validation]{.monash-orange2}: This is used to gain some understanding of the [variance]{.monash-orange2} (as in *bias-variance trade-off* ) of models, and how parameter or algorithm choices affect the performance of the model on future samples.
:::
:::
::: {.column}
::: {.incremental}
- [Bootstrap]{.monash-pink2}: Compute [confidence intervals]{.monash-pink2} for model parameters, or the model fit statistics. can be used similarly to cross-validation samples but avoids the complication of smaller sample size that may affect interpretation of cross-validation samples.
- [Permutation]{.monash-green2}: Used to assess [significance of relationships]{.monash-green2}, especially to assess the importance of individual variables or combinations of variables for a fitted model.
:::
:::
::::
## Cross-validation
- [Training/test split]{.monash-blue2}: make one split of your data, keeping one purely for assessing future performance.
After making that split, we would use [these methods on the training sample]{.monash-orange2}:
- [Leave-one-out]{.monash-orange2}: make $n$ splits, fitting multiple models and using left-out observation for assessing variability.
- [$k$-fold]{.monash-orange2}: break data into $k$ subsets, fitting multiple models with one group left out each time.
## Training/test split [(1/3)]{.smaller}
 [A set of $n$ observations are randomly split into a training set (blue, containing observations 7, 22, 13, ...) and a test set (yellow, all other observations not in training set).]{.smaller}
- Need to [stratify the sampling]{.monash-orange2} to ensure training and test groups are appropriately [balanced]{.monash-orange2}.
- Only one split of data made, may have a lucky or unlucky split, accurately estimating test error relies on the one sample.
[A set of $n$ observations are randomly split into a training set (blue, containing observations 7, 22, 13, ...) and a test set (yellow, all other observations not in training set).]{.smaller}
- Need to [stratify the sampling]{.monash-orange2} to ensure training and test groups are appropriately [balanced]{.monash-orange2}.
- Only one split of data made, may have a lucky or unlucky split, accurately estimating test error relies on the one sample.
[(Chapter5/5.1.pdf)]{.smallest}
## Training/test split [(2/3)]{.smaller}
:::: {.columns}
::: {.column}
[With tidymodels, the function `initial_split()` creates the indexes of observations to be allocated into training or test samples. To generate these samples use `training()` and `test()` functions.]{.smaller}
```{r}
#| label: balanced-data1
d_bal <- tibble(y=c(rep("A", 6), rep("B", 6)),
x=c(runif(12)))
d_bal$y
set.seed(130)
d_bal_split <- initial_split(d_bal, prop = 0.70)
training(d_bal_split)$y
testing(d_bal_split)$y
```
::: {.fragment}
How do you ensure that you get [0.70 in each class]{.monash-orange2}?
:::
:::
::: {.column}
::: {.fragment}
[Stratify the sampling]{.monash-orange2}
```{r}
#| label: balanced-data2
d_bal$y
set.seed(1225)
d_bal_split <- initial_split(d_bal,
prop = 0.70,
strata=y)
training(d_bal_split)$y
testing(d_bal_split)$y
```
Now the test set has 2 A's and 2 B'2. [This is best practice!]{.monash-orange2}
:::
:::
::::
## Training/test split [(3/3)]{.smaller}
:::: {.columns}
::: {.column}
Not stratifying can cause major problems with unbalanced samples.
```{r}
#| label: unbalanced-data
d_unb <- tibble(y=c(rep("A", 2), rep("B", 10)),
x=c(runif(12)))
d_unb$y
set.seed(132)
d_unb_split <- initial_split(d_unb, prop = 0.70)
training(d_unb_split)$y
testing(d_unb_split)$y
```
[The test set is missing one entire class!]{.monash-red2}
:::
::: {.column}
::: {.fragment}
::: {.info}
Always [stratify splitting]{.monash-orange2} by sub-groups, especially response variable classes, and possibly other variables too.
:::
```{r}
#| label: unbalanced-split
d_unb_strata <- initial_split(d_unb,
prop = 0.70,
strata=y)
training(d_unb_strata)$y
testing(d_unb_strata)$y
```
[Now there is an A in the test set!]{.monash-green2}
:::
:::
::::
## Checking the training/test split: response
:::: {.columns}
::: {.column width=30%}
[GOOD]{.monash-green2}
```{r}
#| echo: false
#| label: penguins-good-split1
#| fig-width: 3
#| fig-height: 6
#| out-width: 70%
library(palmerpenguins)
p_tidy <- penguins |>
select(species, bill_length_mm:body_mass_g) |>
rename(bl=bill_length_mm,
bd=bill_depth_mm,
fl=flipper_length_mm,
bm=body_mass_g) |>
filter(!is.na(bl)) |>
arrange(species)
set.seed(224)
p_split <- initial_split(p_tidy,
prop = 0.7,
strata = species)
p_tr <- training(p_split) |>
mutate(set = "train")
p_ts <- testing(p_split) |>
mutate(set = "test")
p_both <- bind_rows(p_tr, p_ts) |>
mutate(set = factor(set, levels=c("train", "test")))
ggplot(p_both, aes(x=species, fill=species)) +
geom_bar() +
facet_wrap(~set, ncol=1, scales="free_x") +
scale_fill_discrete_divergingx(palette="Zissou 1") +
xlab("") +
theme(legend.position="none") + coord_flip()
```
:::
::: {.column width=30%}
[BAD]{.monash-red2}
```{r}
#| echo: false
#| label: penguins-bad-split1
#| fig-width: 3
#| fig-height: 6
#| out-width: 70%
p_bad <- p_tidy |>
mutate(set = factor(ifelse(species == "Adelie", "train", "test"),
levels=c("train", "test")))
ggplot(p_bad, aes(x=species, fill=species)) +
geom_bar() +
facet_wrap(~set, ncol=1) +
scale_fill_discrete_divergingx(palette="Zissou 1") +
xlab("") +
theme(legend.position="none") + coord_flip()
```
:::
::: {.column width=30%}
Check the class proportions of the response by [computing counts and proportions]{.monash-orange2} in each class, and tabulating or plotting the result.
It's [good]{.monash-green2} if there are similar numbers of each class in both sets.
:::
::::
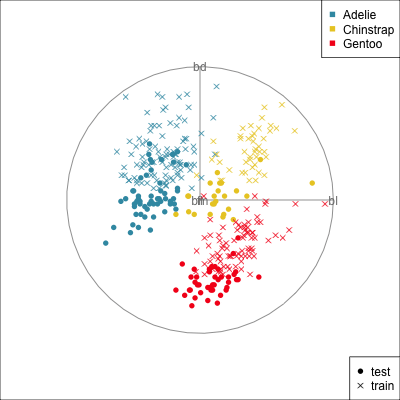
## Checking the training/test split: predictors
:::: {.columns}
::: {.column width="33%"}
[GOOD]{.monash-green2}
```{r}
#| echo: false
#| label: penguins-good-split2
#| eval: false
render_gif(p_both[,2:5],
grand_tour(),
display_xy(col=p_both$species,
pch=p_both$set, shapeset=c(4, 16), rescale=TRUE),
rescale=TRUE,
gif_file = "../gifs/p_split_good.gif",
apf = 1/30,
frames = 500,
width = 400,
height = 400)
```
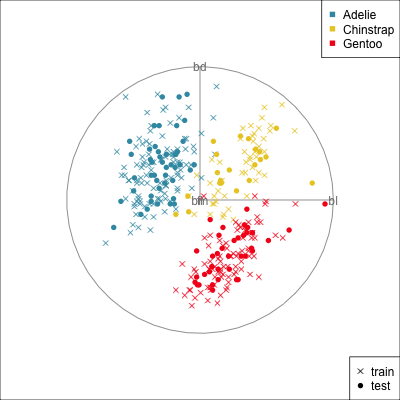{width=500}
[[Make a training/test variable and plot the predictors.]{.monash-orange2} Need to have similar distributions.]{.smaller}
:::
::: {.column width="33%"}
[Looks good]{.monash-purple2 .smaller}
```{r}
#| echo: false
#| label: penguins-bad-split2
#| fig-width: 6
#| fig-height: 3
#| out-width: 80%
p_bad2 <- p_tidy |>
mutate(set = factor(ifelse((species == "Adelie" & bd > 17.5 & fl > 183) | (species == "Chinstrap" & bd > 17.8 & fl > 187) |
(species == "Gentoo" & bd > 14.2 & fl > 211), "train", "test"),
levels=c("train", "test")))
ggplot(p_bad2, aes(x=species, fill=species)) +
geom_bar() +
facet_wrap(~set, ncol=2, scales="free") +
scale_fill_discrete_divergingx(palette="Zissou 1") +
xlab("") +
theme(legend.position="none") + coord_flip()
```
[On the response training and test sets have similar proportions of each class so looks good BUT it's not]{.smaller}
:::
::: {.column width="33%"}
[But BAD]{.monash-red2 .smaller}
```{r}
#| echo: false
#| eval: false
render_gif(p_bad2[,2:5],
grand_tour(),
display_xy(col=p_bad2$species,
pch=p_bad2$set, shapeset=c(4, 16), rescale=TRUE),
rescale=TRUE,
gif_file = "../gifs/p_split_bad.gif",
apf = 1/30,
frames = 500,
width = 400,
height = 400)
```
{width=500}
[Test set has smaller penguins on at least two of the variables.]{.smaller}
:::
::::
## Cross-validation {.transition-slide .center}
## k-fold cross validation [(1/4)]{.smallest .monash-umber2}
:::: {.columns}
::: {.column width=50%}
1. Divide the data set into $k$ different parts.
2. Remove one part, fit the model on the remaining $k − 1$ parts, and compute the **statistic of interest** on the omitted part.
3. Repeat $k$ times taking out a different part each time
:::
::: {.column width=50%}
:::
::::
## k-fold cross validation [(2/4)]{.smallest .monash-umber2}
:::: {.columns}
::: {.column}
1. [Divide the data set into $k$ different parts.]{.monash-blue2}
2. Remove one part, fit the model on the remaining $k − 1$ parts, and compute the **statistic of interest** on the omitted part.
3. Repeat $k$ times taking out a different part each time
:::
::: {.column}
```{r}
#| label: penguins-subset
#| echo: false
set.seed(1140)
p_sub_split <- initial_split(p_tidy,
prop=0.25,
strata=species)
p_sub <- training(p_sub_split)
```
Here are the row numbers for $k=5$ folds:
```{r}
#| label: penguins-CV
p_folds <- vfold_cv(p_sub, 5, strata=species)
c(1:nrow(p_sub))[-p_folds$splits[[1]]$in_id]
c(1:nrow(p_sub))[-p_folds$splits[[2]]$in_id]
c(1:nrow(p_sub))[-p_folds$splits[[3]]$in_id]
c(1:nrow(p_sub))[-p_folds$splits[[4]]$in_id]
c(1:nrow(p_sub))[-p_folds$splits[[5]]$in_id]
```
:::
::::
## k-fold cross validation [(3/4)]{.smallest .monash-umber2}
:::: {.columns}
::: {.column}
1. Divide the data set into $k$ different parts.
2. [Remove one part, fit the model on the remaining $k − 1$ parts, and compute the **statistic of interest** on the omitted part.]{.monash-blue2}
3. Repeat $k$ times taking out a different part each time
:::
::: {.column}
Fit the model to the $k-1$ set, and compute the statistic on the $k$-fold, that was not used in the model fit.
Here we use the **accuracy** as the statistic of interest.
Value for fold 1 is:
```{r}
#| label: penguins-CV-fit
#| echo: false
p_rp1 <- rpart(species~., data=p_folds$splits[[1]])
p_cv1 <- p_sub[c(1:nrow(p_sub))[-p_folds$splits[[1]]$in_id],]
p_cv1 <- p_cv1 |>
mutate(pspecies = predict(p_rp1, p_cv1, type="class"))
accuracy(p_cv1, species, pspecies)
```
:::
::::
## k-fold cross validation [(4/4)]{.smallest .monash-umber2}
:::: {.columns}
::: {.column}
1. Divide the data set into $k$ different parts.
2. Remove one part, fit the model on the remaining $k − 1$ parts, and compute the **statistic of interest** on the omitted part.
3. [Repeat $k$ times taking out a different part each time]{.monash-blue2}
:::
::: {.column}
Here is the **accuracy** computed for each of the $k=5$ folds. [Remember, this means that the model was fitted to the rest of the data, and accuracy was calculate on the observations in this fold.]{.smaller}
```{r}
#| label: penguins-CV-fitk
#| echo: false
acc <- NULL
for (i in 1:5) {
p_rp1 <- rpart(species~., data=p_folds$splits[[i]])
p_cv1 <- p_sub[c(1:nrow(p_sub))[-p_folds$splits[[i]]$in_id],]
p_cv1 <- p_cv1 |>
mutate(pspecies = predict(p_rp1, p_cv1, type="class"))
acc <- c(acc, accuracy(p_cv1, species, pspecies)$.estimate)
}
acc
```
:::
::::
[Recommended reading: Alison Hill's [Take a Sad Script & Make it Better: Tidymodels Edition](https://alison.rbind.io/blog/2020-02-take-a-sad-script-make-it-better-tidymodels-edition/)]{.smaller}
## LOOCV
::: {.info}
Leave-one-out (LOOCV) is a special case of $k$-fold cross-validation, where $k=n$. There are $n$ CV sets, each with [ONE]{.monash-orange2} observation left out.
:::
Benefits:
- Useful when sample size is very small.
- Some statistics can be calculated algebraically, without having to do computation for each fold.
## Where is cross-validation used?
- Model evaluation and selection, by estimating the [generalisability]{.monash-blue2} on future data.
- [Parameter tuning]{.monash-blue2}: finding optimal choice of parameters or control variables, like number of trees or branches, or polynomial terms to generate the best model fit.
- [Variable selection]{.monash-blue2}: which variables are more or less important for the best model fit. Possibly some variables can be dropped from the model.
## Bootstrap {.transition-slide .center}
## Bootstrap [(1/5)]{.smallest .monash-umber2}
A bootstrap sample is a sample that is the [same size as the original data set]{.monash-orange2} that is made [using replacement]{.monash-orange2}. This results in analysis samples that have multiple replicates of some of the original rows of the data. The [assessment set]{.monash-blue2} is defined as the rows of the original data that were [not included]{.monash-blue2} in the bootstrap sample, referred to as the [**out-of-bag** (OOB) sample]{.monash-blue2}.
```{r}
set.seed(115)
df <- tibble(id = 1:26,
cl = c(rep("A", 12), rep("B", 14)))
df_b <- bootstraps(df, times = 100, strata = cl)
t(df_b$splits[[1]]$data[df_b$splits[[1]]$in_id,])
```
Which observations are out-of-bag in bootstrap sample 1?
## Bootstrap [(2/5)]{.smallest .monash-umber2}
- [Bootstrap is preferable]{.monash-orange2} to cross-validation when the [sample size is small]{.monash-orange2}, or if the structure in the data being modelled is [complex]{.monash-orange2}.
- It is commonly used for estimating the [variance of parameter estimates]{.monash-orange2}, especially when the data is non-normal.
## Bootstrap [(3/5)]{.smallest .monash-umber2}
In dimension reduction it can be used to assess if the coefficients of a PC (the eigenvectors) are significantly different from ZERO. The [95% bootstrap confidence intervals]{.monash-orange2} can be computed by:
1. Generating B bootstrap samples of the data
2. Compute PCA, record the loadings
3. Re-orient the loadings, by choosing one variable with large coefficient to be the direction base
4. If B=1000, 25th and 975th sorted values yields the lower and upper bounds for confidence interval for each PC.
## Bootstrap [(4/5)]{.smallest .monash-umber2}
Assessing the loadings for PC 2 of PCA on the womens track data. Remember the summary:
```{r echo=FALSE}
track <- read_csv(here::here("data/womens_track.csv"))
track_pca <- prcomp(track[,1:7], center=TRUE, scale=TRUE)
track_pca
```
Should we consider `m800`, `m400` contributing to PC2 or not?
## Bootstrap [(5/5)]{.smallest .monash-umber2}
:::: {.columns}
::: {.column}
We said that *PC2 is a contrast between short distance events and long distance events, particularly 100m, 200m vs 1500m, 3000m, marathon*. [How reliably can we state this?]{.monash-orange2}
```{r}
#| label: bootstrap-PC
#| code-fold: true
library(boot)
compute_PC2 <- function(data, index) {
pc2 <- prcomp(data[index,], center=TRUE, scale=TRUE)$rotation[,2]
# Coordinate signs: make m100 always positive
if (sign(pc2[1]) < 0)
pc2 <- -pc2
return(pc2)
}
# Make sure sign of first PC element is positive
set.seed(201)
PC2_boot <- boot(data=track[,1:7], compute_PC2, R=1000)
colnames(PC2_boot$t) <- colnames(track[,1:7])
PC2_boot_ci <- as_tibble(PC2_boot$t) %>%
gather(var, coef) %>%
mutate(var = factor(var, levels=c("m100", "m200", "m400", "m800", "m1500", "m3000", "marathon"))) %>%
group_by(var) %>%
summarise(q2.5 = quantile(coef, 0.025),
q5 = median(coef),
q97.5 = quantile(coef, 0.975)) %>%
mutate(t0 = PC2_boot$t0)
pb <- ggplot(PC2_boot_ci, aes(x=var, y=t0)) +
geom_hline(yintercept=0, linetype=2, colour="red") +
geom_point() +
geom_errorbar(aes(ymin=q2.5, ymax=q97.5), width=0.1) +
xlab("") + ylab("coefficient")
```
[Confidence intervals for `m400` and `m800` cross ZERO, hence zero is a plausible value for the population coefficient corresponding to this estimate.]{.smaller}
:::
::: {.column}
```{r echo=FALSE}
#| out-width: 90%
#| fig-width: 6
#| fig-height: 6
pb
```
:::
::::
## Permutation {.transition-slide .center}
## Permutation [(1/3)]{.smallest .monash-umber2}
:::: {.columns}
::: {.column}
Permutation [breaks relationships]{.monash-orange2}, and is often used for conducting [statistical hypothesis tests]{.monash-orange2}, without requiring too many [assumptions]{.monash-orange2}.
::: {.column width=40%}
DATA
```{r echo=FALSE}
set.seed(238)
dp <- tibble(x=c(rexp(5), rexp(5,0.3)+0.5), cl=c(rep("A", 5), rep("B", 5)))
dp
```
:::
::: {.column width=40%}
PERMUTE `cl`
```{r echo=FALSE}
set.seed(246)
dpp <- dp |> mutate(cl = sample(cl))
dpp
```
:::
:::
::: {.column}
[Is there a difference in the medians of the groups?]{.smaller .monash-blue2}
```{r echo=FALSE}
set.seed(238)
n <- 50
dp <- tibble(x=c(rexp(n), rexp(n,0.3)+0.5),
cl=c(rep("A", n), rep("B", n))) |>
mutate(cl <- factor(cl))
dpp <- dp |> mutate(cl = sample(cl))
dp_plot <- ggplot(dp, aes(x=cl, y=x)) +
geom_point(alpha=0.6, size=3) +
ggtitle("DATA")
dpp_plot <- ggplot(dpp, aes(x=cl, y=x)) +
geom_point(alpha=0.6, size=3) +
ggtitle("PERMUTED")
grid.arrange(dp_plot, dpp_plot, ncol=2)
```
:::
::::
## Permutation [(2/3)]{.smallest .monash-umber2}
:::: {.columns}
::: {.column}
Is there a difference in the medians of the groups?
```{r echo=FALSE}
dp_meds <- dp |>
group_by(cl) |>
summarise(med = median(x))
dp_plot +
geom_point(data=dp_meds, aes(x=cl, y=med), colour="red", size=5)
```
:::
::: {.column}
Generate $k$ permutation samples, compute the medians for each, and compare the difference with [original]{.monash-red2}.
```{r echo=FALSE}
dp_perm <- dp |>
specify(x ~ cl) |>
hypothesize(null = "independence") |>
generate(reps = 1000, type = "permute") |>
calculate("diff in medians", order = c("A", "B")) |>
mutate(stat = abs(stat)) # Not interested in direction
dp_true <- abs(dp_meds$med[1]-dp_meds$med[2])
ggplot(dp_perm, aes(x=stat)) +
geom_histogram(binwidth = 0.1, colour="white") +
geom_vline(xintercept=dp_true, colour="red")
```
:::
::::
## Permutation [(3/3)]{.smallest .monash-umber2}
- [Caution]{.monash-orange2}: permuting small numbers, especially classes may return very [similar samples to the original data]{.monash-orange2}.
- [Stay tuned for random forest models]{.monash-green2}, where permutation is used to help assess the [importance of all the variables]{.monash-green2}.
## Simulation {.transition-slide .center}
## Simulation [(1/2)]{.smallest .monash-umber2}
Simulation from known statistical distributions allows us to [check data and calculations against what is known]{.monash-blue2} is controlled conditions.
For example, how likely is it to see the extreme a value if my data is a sample from a normal distribution?
## Simulation [(2/2)]{.smallest .monash-umber2}
:::: {.columns}
::: {.column}
```{r echo=FALSE}
#| label: track-scree
#| fig-width: 6
#| fig-height: 6
#| out-width: 80%
ggscree(track_pca, q=7) +
ggtitle("Scree plot of womens track data")
```
:::
::: {.column}
[Grey line]{.monash-gray50} is a guide line, computed by doing PCA on 100 samples from a standard $p$-dimensional normal distribution.
That is a [comparison]{.monash-orange2} of the correlation matrix of the track data with a correlation matrix that is the identity matrix, where there is [no association between variables]{.monash-orange2}.
The largest variance we expect is under 2. The observed variance for PC 1 is much higher. Much larger than expected, very important for capturing the variability in the data!
[Why is there a difference in variance, when there is no difference in variance?]{.smallest .monash-blue2}
:::
::::
## What can go wrong in high-dimensions {.transition-slide .center}
## Space is huge!
:::: {.columns}
::: {.column}
```{r}
set.seed(357)
my_sparse_data <- tibble(cl = c(rep("A", 12),
rep("B", 9)),
x1 = rnorm(21),
x2 = rnorm(21),
x3 = rnorm(21),
x4 = rnorm(21),
x5 = rnorm(21),
x6 = rnorm(21),
x7 = rnorm(21),
x8 = rnorm(21),
x9 = rnorm(21),
x10 = rnorm(21),
x11 = rnorm(21),
x12 = rnorm(21),
x13 = rnorm(21),
x14 = rnorm(21),
x15 = rnorm(21)) |>
mutate(cl = factor(cl)) |>
mutate_if(is.numeric, function(x) (x-mean(x))/sd(x))
```
Do we agree that there is no REAL difference between A and B?
:::
::: {.column}
```{r eval=FALSE, echo=FALSE}
render_gif(my_sparse_data[,-1],
guided_tour(lda_pp(my_sparse_data$cl), sphere=TRUE),
display_xy(col=my_sparse_data$cl, axes="bottomleft"),
rescale=TRUE,
gif_file = "../gifs/my_sparse_data.gif",
apf = 1/30,
loop = FALSE,
frames = 1000,
width = 400,
height = 400)
```
::: {.fragment}
{width=500}
:::
::: {.fragment}
Difference is due to having [insufficient data with too many variables]{.monash-orange2}.
:::
:::
::::
## Regularisation
The fitting criteria has an added penalty term with the effect being that some [parameter estimates are forced to ZERO]{.monash-orange2}. This effectively reduces the dimensionality by removing noise, and variability in the sample that is consistent with what would be expected if it was purely noise.
[Stay tuned for examples in various methods!]{.monash-blue2}
## Next: Logistic regression and discriminant analysis {.transition-slide .center}